Engineering case study / October 2026
Italian
Flood Atlas.
The Atlas compares satellite radar, model predictions and flood maps for Castel Bolognese during the May 2023 floods.
I built the data-processing pipeline, trained and evaluated the flood model, and developed the interactive map. Model accuracy is measured on the public Kuro Siwo benchmark; the Italian study shows how imagery dates and local conditions affect interpretation.
Explore the AtlasData audit and scope
Before training, I checked acquisition times, coverage, preprocessing and labels. The Italian emergency maps were based on observations taken at different times from the radar images. They also lacked an explicit dry class, so they could not serve as labels for measuring the model’s accuracy on those images.
I used Kuro Siwo for training and evaluation because it provides labels interpreted from the radar imagery itself. The Italian event is a separate, qualitative demonstration. Processing code, parameters, evaluation splits and source records are versioned; raw imagery and model checkpoints stay outside Git.
Processing and publication
Model development uses Kuro Siwo. The exported model runs on prepared Italian radar images, and the website serves the resulting layers without running inference.
-
Radar preparation
SNAP calibrates and terrain-corrects Sentinel-1 images onto a shared grid.
-
Benchmark evaluation
A PyTorch U-Net and a fixed radar-change baseline are scored on held-out events.
-
Italian inference
ONNX Runtime runs the model on a CPU and writes prediction layers with source records.
-
Web delivery
SvelteKit and MapLibre display the prepared layers and basemap tiles on Cloudflare Pages.
Benchmark results
The baseline identifies dark radar pixels whose reflected signal, or backscatter, drops from the pre-event mean. I fitted its thresholds on training data and froze them before scoring. The U-Net uses both radar channels, VV and VH, across three dates. I excluded elevation after finding artifacts in the benchmark’s terrain data.
Some training and validation image tiles covered the same locations. To prevent that overlap from influencing model selection, I selected the model using only validation events with no training overlap. Once the model and evaluation policy were fixed, I scored both methods once on the same 15,896 test tiles across 10 event activations.
| Method | Precision | Recall | IoU |
|---|---|---|---|
| U-Net v1 | 0.821 | 0.739 | 0.636 |
| VV change baseline | 0.651 | 0.764 | 0.542 |
Precision measures how much of the predicted flood matches the labels; recall measures how much of the labeled flood is detected. Intersection over union (IoU) divides the overlap between predicted and labeled flood by their combined extent. These scores apply to the benchmark alone.
The U-Net has higher precision and IoU than the baseline, with lower recall: it makes fewer false flood predictions but misses more labeled flood. It still confuses flood with permanent water in one test activation, and moderate backscatter decreases can cause false flood predictions. Because the labels were interpreted from the same radar imagery, these scores measure agreement with expert radar interpretation.
Castel Bolognese, May 2023
Qualitative study
The Italian radar image was acquired on 22 May, about five days after the main flood. The figure pairs it with Copernicus Emergency Management Service (CEMS) outlines derived from an optical image taken roughly five hours later. It shows the radar and reference maps; model predictions can be compared in the live Atlas.
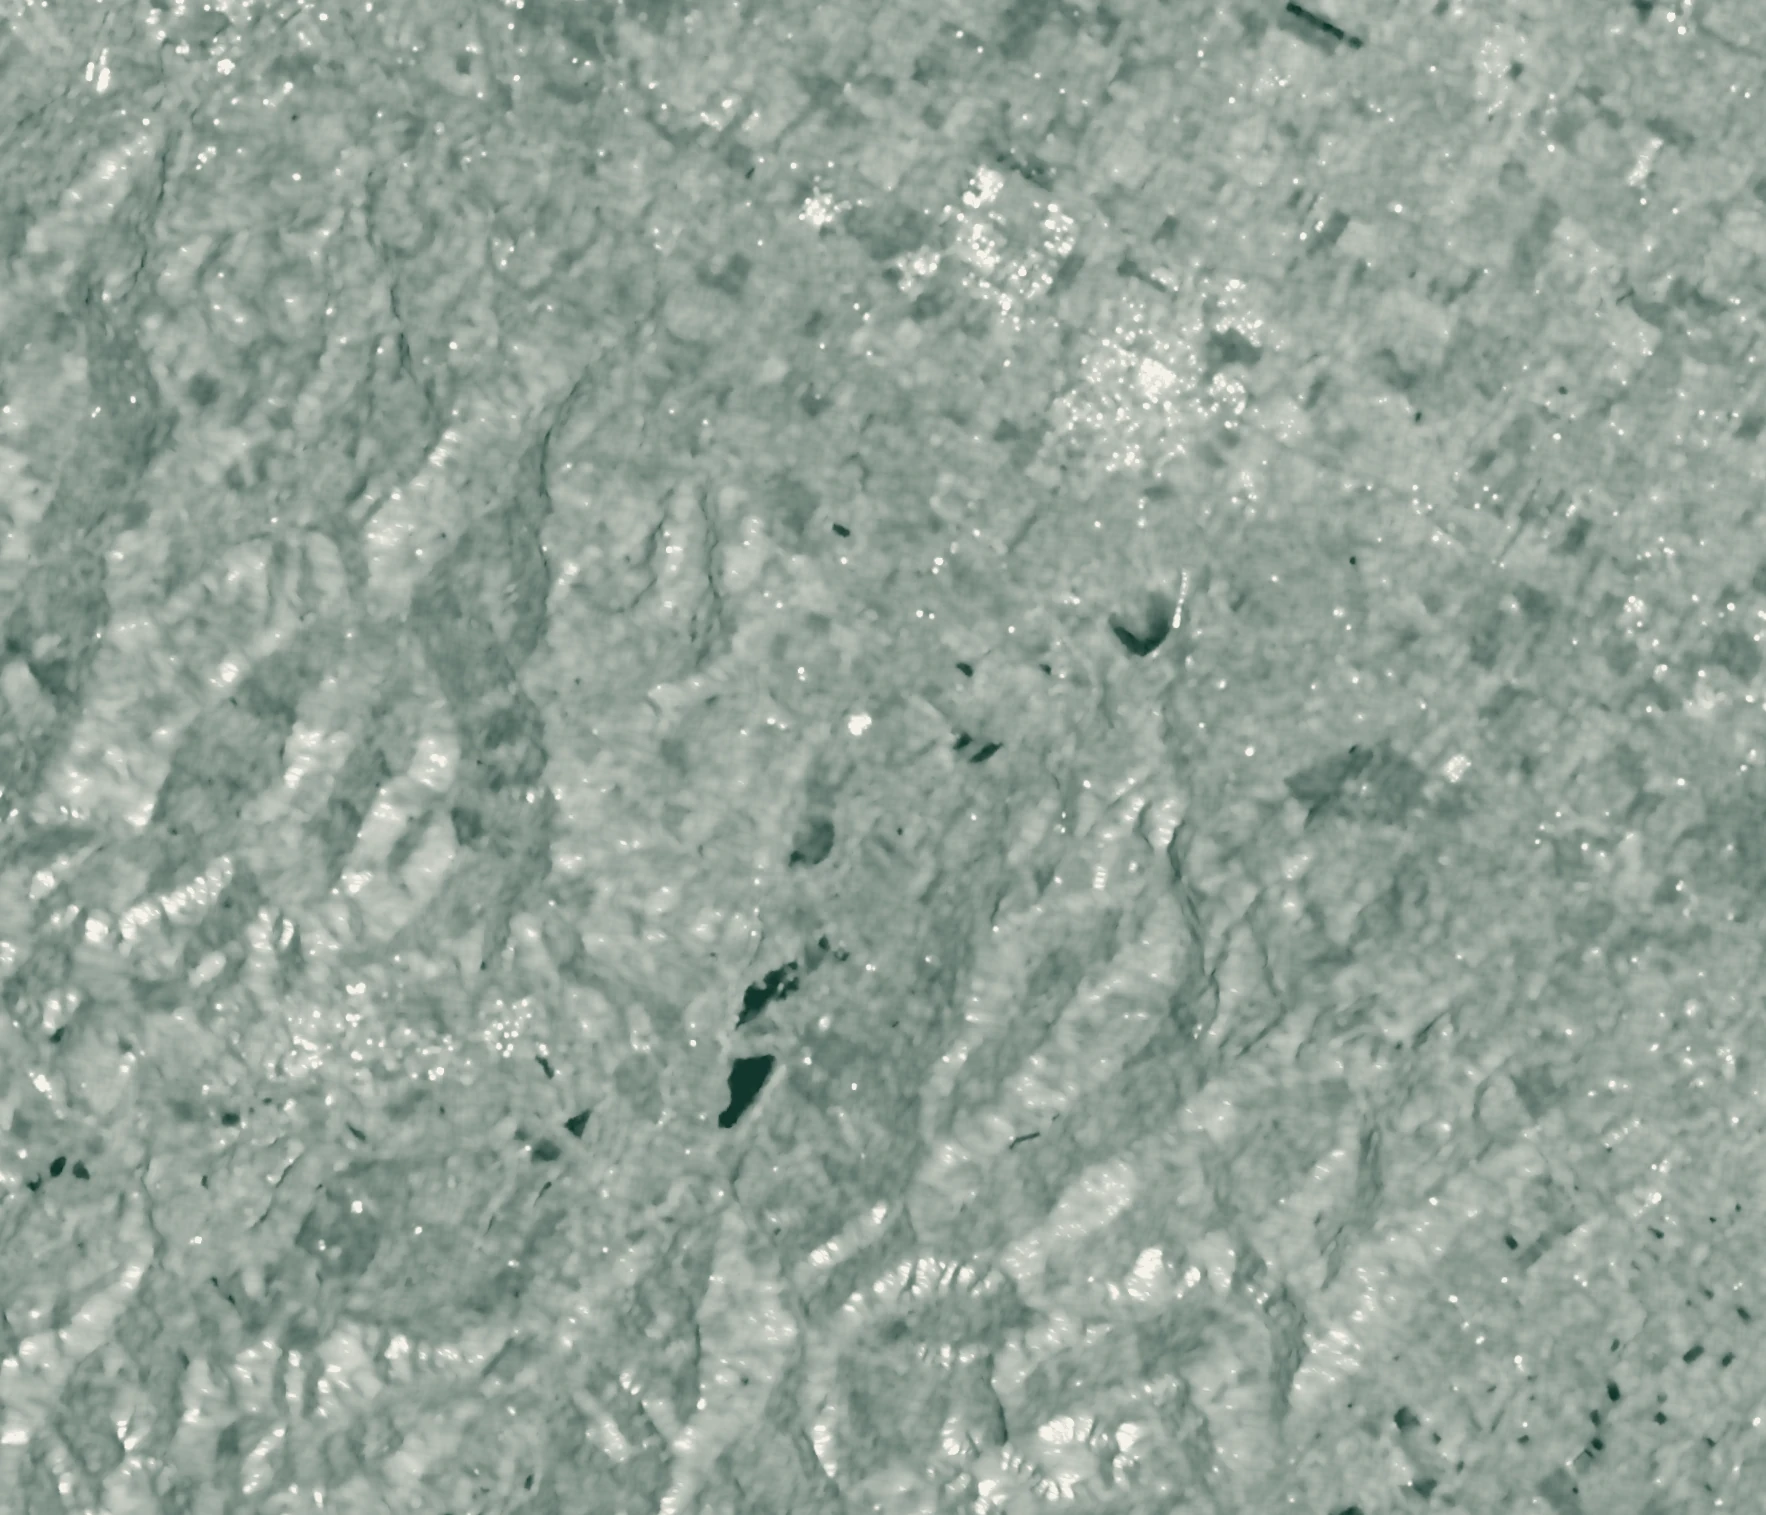
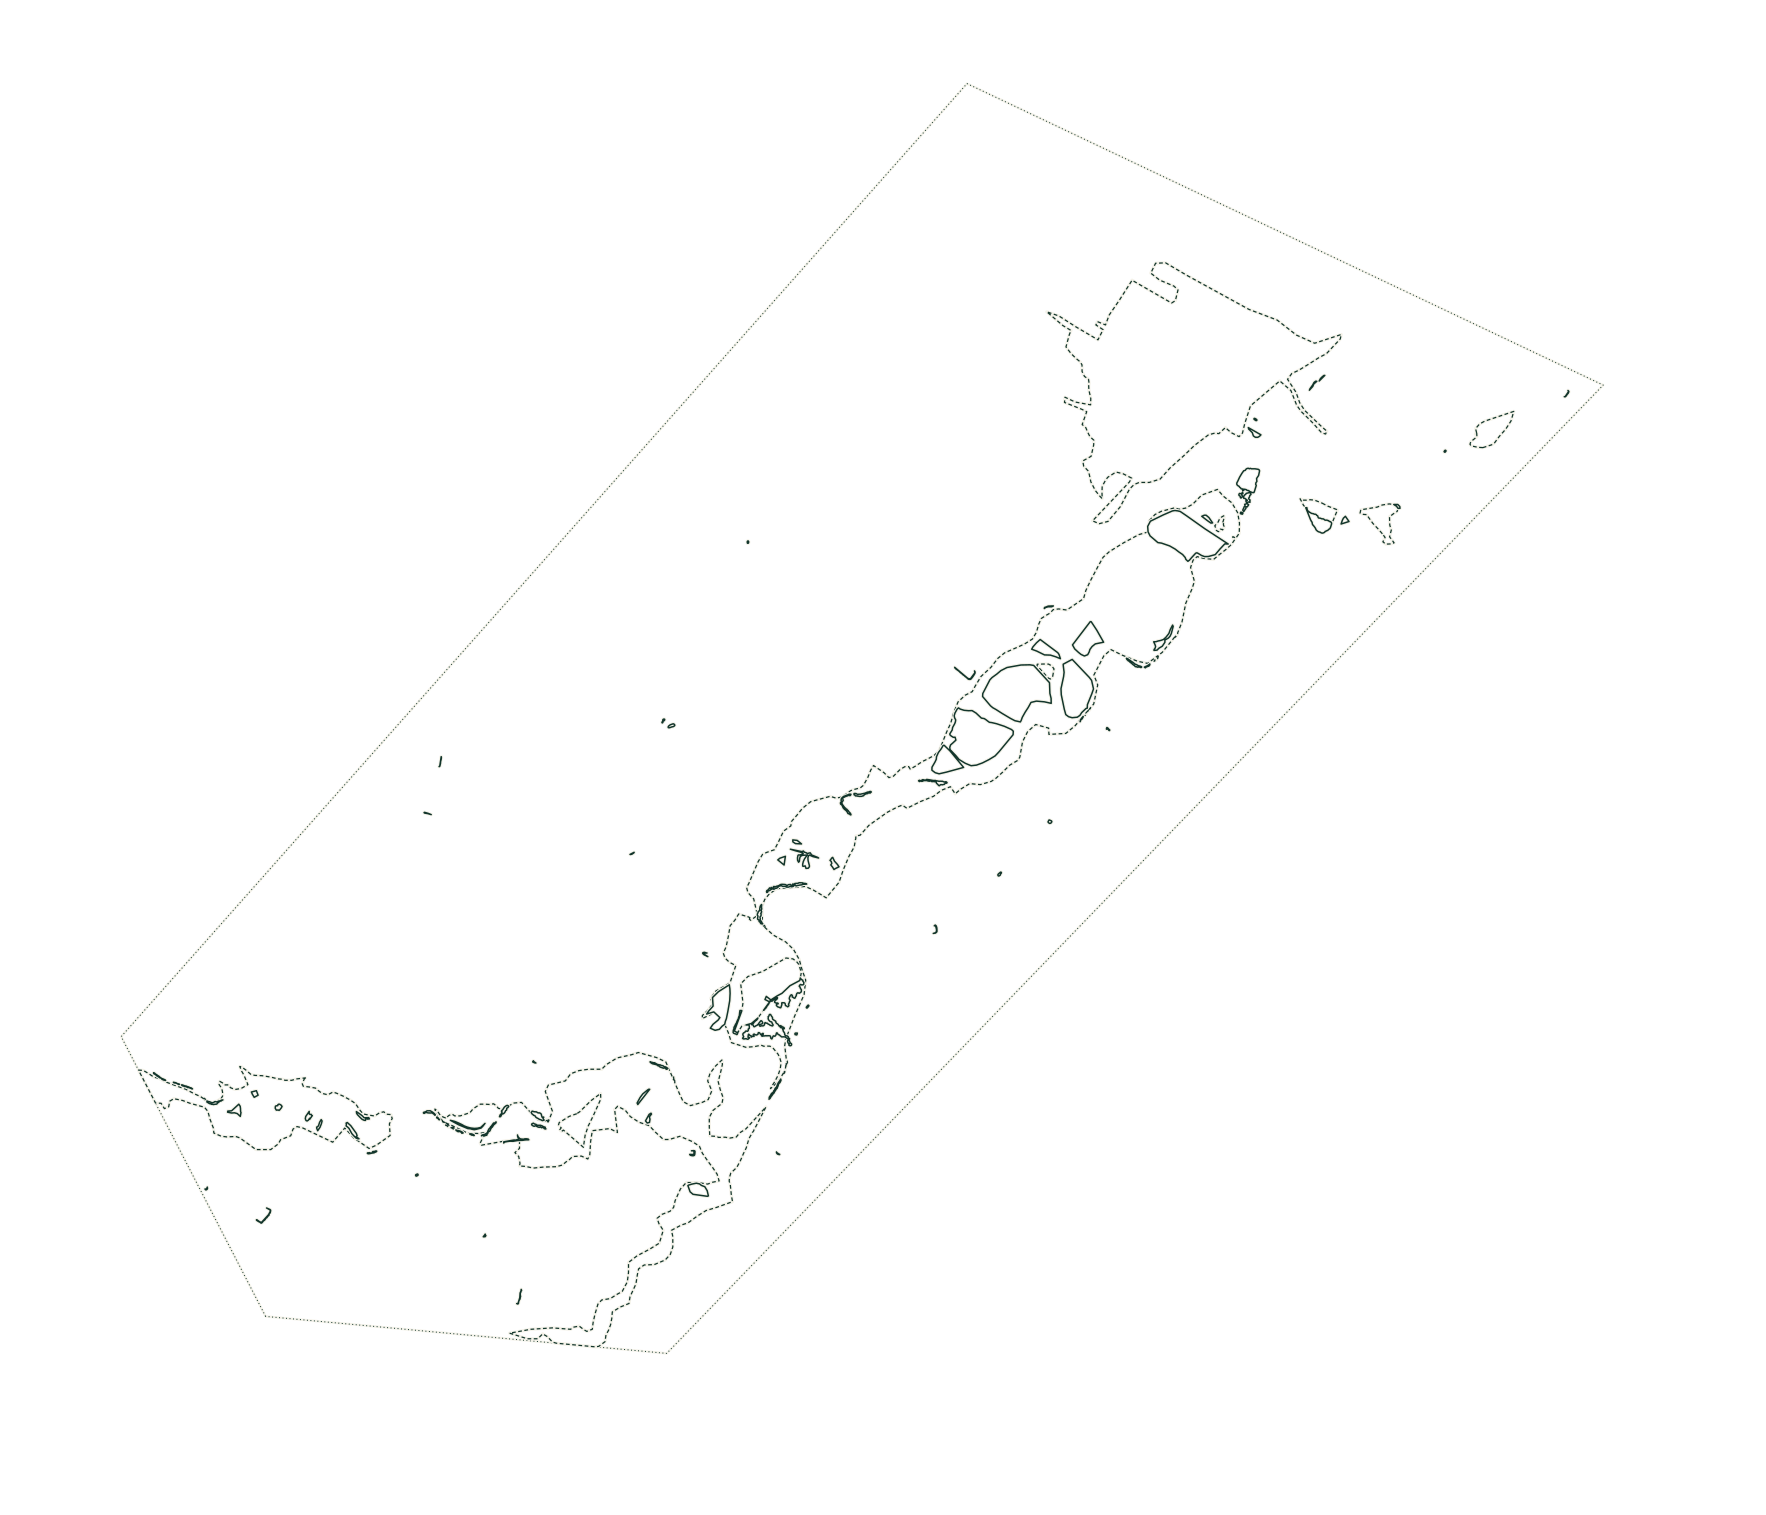
- Flooded area
- Flood trace
- Reference coverage
- Sentinel-1 radar
- CEMS optical reference
Flood traces mark deposits or damage; they do not indicate standing water.
Contains modified Copernicus Sentinel data (2023). Reference © European Union, Copernicus Emergency Management Service (2023), EMSR664.
Both methods predict flood in only a small part of the area mapped as flooded by CEMS. The radar image shows little dark open water. Water may have receded, while vegetation and buildings can also affect its radar appearance; this comparison does not establish which explanation accounts for the difference.
One of the pre-event images, from 10 May, also follows an earlier flood. Any water still present on both dates could be classified as permanent water. The interface therefore keeps acquisition dates and reference sources visible. Overlap with the CEMS outlines describes the maps; it does not measure the model’s accuracy in Italy.
Inference and delivery
To check the ONNX export, I compared its predictions with the original model. Across 135,859,080 validation pixels, ONNX Runtime and PyTorch float32 disagreed on 1 pixel. CPU measurements showed that memory use limits the area processed in one pass. Inference runs offline, and its outputs are published as static files.
The Atlas serves static layers and self-hosted basemap tiles through Cloudflare Pages. SvelteKit generates the pages, and MapLibre provides the interactive comparison map. Keyboard controls and shareable views support map navigation; a static figure remains available without JavaScript. The personal site builds independently of the Atlas, using the same shared design package.
Prepared layers let the map work without an inference server or database. Automated checks cover published values, layer provenance, asset sizes and accessibility. The Atlas remains a portfolio study of historical floods and has not been validated for operational use in Italy.
Map and technical details
Use the live Atlas to compare radar images and predictions. Its methods section gives the evaluation details, and the event manifest records each layer’s sources and processing.
Kuro Siwo: Orion AI Lab, CC BY 4.0. Full credits.